Showing posts with label SQL Server Reporting Services. Show all posts

Sunday, January 15, 2017

Exploring BI Tools: A learning perspective

This tutorial will take you on exploration of different BI tools that are available in market. The focus of this tutorial will be to focus on reporting features of different tools. We will start with SQL Server Reporting Services and then we will move forward with other in-demand tools in business intelligence market. To start with our exploration, we needed a dataset. We just selected AdventureWorks database of SQL Server, however, any interesting dataset could be used to achieve the desired outcome. To keep us focused, we targeted the Shipment data of AdventureWorks. Our interest is to identify, what type of shipment method is frequently used and how their usage and cost has varied across years. In this connection, we formulated our initial query to extract the total purchase orders shipped each year using each of the shipping methods and their associated total cost. It is just a scenario taken at run-time to have a starting point. You can try/explore your own scenario, if you want. The SQL query that is used in this tutorial is as shown in Figure 1.

Figure 1: Shipment method exploration query

Now it may vary on individuals, how they prefer to use this query. Few might want to use them directly as part of report. Few might find it feasible to create a view of the query. If similar query is to be executed on large database, then creating a materialized view or an SQL Server Analysis Cube might also become feasible. We will just create a stored procedure of the query and we will use it for creating our reports. Stored procedures are more scalable, maintainable, and better in terms of performance.

SQL Server Reporting Services provides us the provision to create report using tabular as well as matrix layout. Suitability of each layout depends on the requirements of the report. Similarly, how the report designer wants to display their data may very according to business requirements and designer thinking style. We will start with very simple matrix layout based report with out visualization features. We kept it for simplicity of the tutorial and author understand that the use of visual artifacts will be more beneficial for our targeted analysis of different shipment methods. Our first report on SQL Server Reporting Services looks like the one shown in Figure 2.

Figure 2: Shipment method analysis report using SQL Server Reporting Services

PowerBI is another important business intelligence tool, highly in-demand in business intelligence market at the moment. We make the same data available to a customer using PowerBI as shown below:


A powerful feature of PowerBI is that it allows us to upload the PowerBI workbook online and then making it accessible to other users on application webpage. As we identified earlier that we created a stored procedure of our report, we will need a simplet T-SQL script to make use of our stored procedure in PowerBI. the script is provided below in Figure 3.

Figure 3: Calling SQL Server Stored Procedure in PowerBI

Microstrategy is another important tool that can be used for creation of similar report on this data. A simple report developed in Microstrategy will look like as show in Figure 4.

Figure 4: Shipment Method Analysis Report using Microstrategy
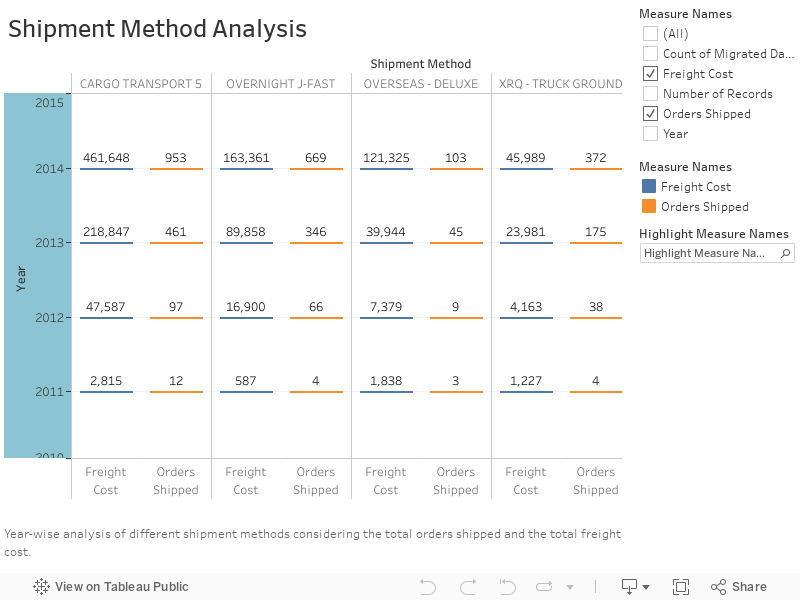
Tableau, the most in-demand and hot in market at the moment. And its truly awesome to work with. I made use of Tableau Desktop 15 day trials to get my hands-on of this feature-rich and easy to use tool. It also provides publishing Tableau work online using public profile. The same shipment method analysis report when created and published using Tableau will look like as it shown below:

Friday, March 29, 2013

Business Intelligence Using SharePoint Portal Server 2013

In this tutorial, you will be introduced with how to use SharePoint Portal Server 2013 for Business Intelligence purposes. I have already uploaded the snapshots of steps. I will add comments shortly.


Reporting Results Using SQL Server Reporting Services

In our previous tutorial, we generated TPC-H Query 1 results with near to zero response time using SQL Server Analysis Services. In all our previous tutorials related with TPC-H Query 1, we only attempted to process the query to get the required results. Each query result is of importance for end-user. If your end-user is a business user and your query results are required for decision making. We should present our result using an appropriate reporting tool. In this tutorial, we will focus on SQL Server Reporting Services. For generating reports using SQL Server Reporting Services, we will be using SQL Server Business Intelligence Development Studio. For reports, we have a dedicated project type, i.e. Report Server Project. Create a new project for Report Server Project as shown in dialog below:


As the project is created, you will have to add report to your project.


As the report is added, you will end-up on Report Wizard dialog. This Report Wizard make it easy for developers to complete the most of report generation work.


As you move next, the first step as in any report generation process is to select the appropariate data source for your report. You data source could reside on any supported database or data services. In this tutorial, we will be connecting with SQL Serve Analysis Services as shown in figure below.


Once we are done with creating the connection, the next step is to write an appropriate query to extract the required data from data source to make it available on our report. For this purpose, we have a query designer, which facilitate us to create a query using GUI.


However, if you are comfortable with MDX query, which you should be after working with our tutorial on OLAP Query Languages then you can also write an MDX query by yourself as shown in figure below.


After completing the query part, on the next screen Report Wizard will ask you to select the report type. If you want to report a multi-dimensional cube data then Matrix (also know as cross-tab) is the best suitable report type. However, Tabular report type can also be used to report multi-dimensional cube data.


For Matrix report type, wizard will ask you to specify, what content will be displayed at rows and columns.


There are many different styles available for your report appearance. You can select one appropriate for your report audience and content.


On the next screen, you are done with your report creating task. Give your report an appropriate name.


After completing the wizard, you can view the report in design window.


To preview the report, you can make use of preview tab.


In report designer, at bottom you will find Row Groups and Column Groups sections. You can alter the row groups and column group settings from their. For example, in figures below, we are changing the group properties for Calendar_Year group.


We change the sort order of Calendar_Year.